June
### Unveiling Guanxi: Resolving Contract Failure
Xinyu Hou
"天时,地利,人和 (Opportunity, timing, and harmony with people)" - Sun Tzu, The Art of War
Imagine deals made over tea, where trust outweighs contracts, and relationships dictate success. Welcome to "guanxi," a cornerstone of Chinese society where interpersonal connections are tied to career and business success. Guanxi is a double-edged sword: it can facilitate collaborations or fuel corruption. This paper explores guanxi's dual nature and its role in resolving contract failures when legal systems falter and policy barriers loom.
# The Double-Edged Sword of Guanxi
Meet Zhang, an entrepreneur with a startup specializing in air purification technology. Bureaucratic delays in obtaining permits threaten his launch. Frustrated by slow formal processes, Zhang turns to his guanxi network. He contacts Li, a fellow townsman with government connections. Over dinner, Zhang explains his project and talks about the town they are both from, earning Li's trust. Li leverages his network, securing a meeting with an important official. Thanks to Li's introduction, Zhang's application is expedited, and his company quickly gets the permits. At a press conference, Zhang publicly thanks Li, solidifying their relationship for future collaborations.
# Guanxi v.s. Western Networking
Guanxi, meaning "relationships" or "connections," is more than a term in China; it’s a way of life rooted in ancient philosophy emphasizing family bonds and social harmony. Both guanxi and networking build interpersonal connections for information, resources, and opportunities, stressing mutual benefit sustained by exchanging favors and support. Trust and reputation are crucial in both contexts.
There are differences: Guanxi, rooted in Confucian culture, emphasizes family and long-term reciprocity. Networking focuses on personal achievement and short-term reciprocity. Guanxi involves deep, enduring ties often lasting a lifetime, while networking is more professional and short-term. Guanxi operates through informal channels, emphasizing personal favors and etiquette, whereas networking uses formal avenues, prioritizing efficiency and directness. Maintaining guanxi demands significant time and resources with high social risks but potentially substantial long-term rewards. Western networking is less costly, lower-risk, and offers more immediate, specific returns.
# Guanxi in Resource Allocation
In Russia, a similar concept is known as "Блат" (blat), and in India, it is called "Sifarish." But why does guanxi shine in weak institutional environments with low information transparency? Resources are scarce, especially valuable ones. To allocate these scarce resources efficiently, societies need "game rules." One common rule is the invisible hand of the market, where the highest bidder secures the resources. Markets minimize waste but only function properly when a robust legal system enforces property and contractual rights—a cornerstone of capitalism.
In environments where trust is scarce and legal frameworks are shaky, alternative game rules prevail. One such rule is “the weak are meat, the strong do eat," akin to the law of the jungle. A more civilized rule is the rule of seniority and connections, or the rule of guanxi, where resource allocation is determined by social capital rather than physical capital.
Guanxi inevitably has its dark side. It fosters corruption and nepotism, allowing individuals to exploit connections for unqualified positions and gain unfair advantages. This misuse undermines meritocracy, exacerbates inequality, and breeds resentment—precisely what anti-corruption campaigns aim to combat. Whether good or bad, guanxi forms an extremely stable network. It's reminiscent of the movie "The Godfather," where personal favors are essential once you are within the network. Refusing to return a favor can lead to social death. This mutual obligation reinforces and perpetuates the guanxi network, ensuring its continued influence and strength.
# Guanxi vs. Direct Transfers: A Tale of Two Strategies
In "Direct Transfer and Guanxi in Resolving Contract Failure," guanxi and direct monetary transfers are compared as mechanisms for facilitating transactions. In weak legislative environments, each method has strengths and weaknesses.
Direct Transfers use money to win resources, often as an "entry fee" or "license cost." This approach is simple and clear but can distort incentives. Officials might raise entry barriers to extract more rents, stifling competition and innovation.
Guanxi relies on personal relationships to overcome obstacles, often established by "luck." By implementing guanxi, it mitigates the information asymmetry problem and smooths transactions. However, establishing these relationships requires time and effort, often inaccessible to those without existing networks.
# Model Insights
We use a game theory model to unravel guanxi's and direct transfers' complexities. Imagine an emerging market where officials set the rules, and entrepreneurs decide whether to use guanxi, engage in direct transfers, or exit the market entirely, and the official can choose whether to approve the project.
Key findings:
1. Low-quality projects: Shutting down both guanxi and transfer channels might be best. This prevents rent-seeking officials from distorting incentives and causing social damages.
2. Good projects: Guanxi is often more effective than direct transfers. It aligns officials' and entrepreneurs' interests by addressing information asymmetry and breaking entry barriers.
3. Combined channels: Enhancing self-selection among officials and entrepreneurs by allowing both channels can be beneficial if officials' interests align with social welfare. Granting pro-social officials more freedom is advantageous since they possess better information. Conversely, if officials are less pro-social, it is preferable to restrict their ability to choose channels for obtaining rents. This idea resonates with the findings in Dybvig and Fu's (2019) paper, "Tigers and Flies: Conflicts of Interest, Discretion and Expertise in a Hierarchy," which claims that fighting corruption and imposing stringent constraints are substitutes: enhancing one reduces the effectiveness of the other. Additionally, the paper highlights that combating corruption and training lower-level officials are complements: improving one enhances the value of the other.
# Conclusion
Regulation and deregulation, stability, and economic growth are always concerns for policymakers. Conflicts of interest between rule-makers, game players, and society often arise, making it unclear whether less rent-seeking or a blanket ban is beneficial. As we can see, guanxi, which regulates behavior and builds trust among officials and entrepreneurs, can be a way of smoothing out transactions. In particular, a pro-social official has more information, setting rules that encourage good behavior aligns the official’s interests with social welfare, reducing the need for regulation. Conversely, if a corrupt official has more information, regulation is necessary to prevent harm to society.
This paper suggests that guanxi can be effective in emerging markets but acknowledges that it has limitations. For instance, the dynamics of guanxi and its impact on competition and productivity need further exploration.
Future research should investigate the role of competition, the changing use of guanxi and direct transfers over time, and the long-term effects of guanxi cultivation and information reusability. Understanding these aspects can provide betterinsights into the balance between regulation and the use of social capital in resource allocation.
References
Hou, X. (2021). “Direct Transfer and Guanxi in Resolving Contractual Failure”
Dybvig, Philip H., and Yishu Fu. "Tigers and Flies: Conflicts of Interest, Discretion and Expertise in a Hierarchy." (2019).
May 2024
Oğuzhan Karakaş – CERF Fellow – April 2024
Natural, Social and Financial Capitals
The Dasgupta Review (2021) argues that we are amidst a global crisis, where natural systems are on the verge of a human-made breakdown, and biodiversity must be put at the core of the economics to address this problem. Within this context, it is important to understand how the financial development/capital affects biodiversity richness and abundance of natural resources, which are central to economic prosperity.
The Environmental Kuznets Curve (EKC) hypothesises an inverted U-shaped relation between the level of environmental degradation and the economic growth: EKC would suggest that economic development initially causes deterioration in the environment (through pre-industrial economies, such as agriculture), which then eases (through industrial economies) and improves (through postindustrial economies, such as service sector) as the economic development improves. Analysing the effect of economic development on natural capital is not very straightforward, due to measurement issues and other endogeneity concerns such as reverse causality.
In a project titled “Natural, Social and Financial Capitals”, CERF Fellow Oğuzhan Karakaş, and research collaborators Annalisa Tonetto and Alessa Widmaier, analyse how financial development affects the loss of biodiversity, within the context of Italy. In their analysis, the authors built upon Guiso, Sapienza and Zingales (AER-2004), who find that social capital (instrumented by electoral participation and blood donation) improves the financial development, through enhancement of trust among the
economic actors.
In their analysis, the authors find support for the EKC hypothesis. The authors first establish that social capital increases GDP per capita. Next, they find that (predicted) GDP per capita has an inverted Ushaped relation with the loss of biodiversity (measured by four different measures of biodiversity: Mean Species Abundance, Biodiversity Intactness Index, Deviation from Potential Natural Vegetation and a measure obtained by applying Principal Component Analysis to the previously mentioned biodiversity measures). The analysis is a cross section that consider the most recent year available for each biodiversity measures (2020 or 2022) and controls for GDP per capita, GDP per capita squared,
Education, Education squared, Fertility, Gender, Crime, Age, Civil Unions and includes Industry Fixed Effects.
References mentioned in this post:
• Dasgupta, P. (2021), The Economics of Biodiversity: The Dasgupta Review. (London: HM
Treasury).
• Guiso, Luigi, Paola Sapienza, and Luigi Zingales. 2004. "The Role of Social Capital in Financial
Development." American Economic Review, 94 (3): 526-556
April 2024
The Impact of Mergers and Acquisitions (M&A) on Talent Reallocation?
By Luxi (Lucy) Wang, CERF Research Associate, Cambridge Judge Business School, University of Cambridge
1 Apr 2024
The article at a glance
By analysing a sample of 803 public M&A deals spanning over three decades, CERF research associate Luxi (Lucy) Wang studies the impact of M&As on innovative labours by examining inventors’ turnovers and productivity changes.
Introduction
The strategic move of Mergers and acquisitions (M&As) is often accompanied with resource reallocations, including both physical assets and human capital. While prior research has well documented extensive physical asset restructuring after M&As (Kaplan and Weisbach, 1992; Schoar, 2002; Maksimovic et al., 2011), little attention has been given to understanding how these transactions affect the allocation of highly skilled labour, particularly inventors within firms. In this blog post, a recent study by CERF research associate Lucy Wang, has shed light on this question by analysing the reallocation of a particular type of human capital — i.e., inventors — both within and beyond merging firms through M&A deals.
Key questions addressed
This study answers three primary questions:
- What is the extent of inventor restructuring after M&As?
- How does the innovation productivity of inventors change after the M&As, both for those who remain with the combined entity and for those who depart?
- What are the possible economic forces driving such reallocation?
Main findings
The main findings of this study can be summarized as the following. Mergers and acquisitions (M&As) of innovative firms lead to a significant restructuring of the inventor labour force driven by abnormally high turnover for target firm inventors. Following the merger, inventors in the combined entity (primarily inventors from acquiring-firms and newly-hired inventors) file more citation-weighted patents. Interestingly, departing inventors also increase patenting productivity significantly.
Examining restructuring channels
The study explores two non-mutually exclusive plausible channels through which acquiring firms restructure their inventors: assortative matching and screening. While assortative matching channel, wherein firms retain inventors with a better employer-employee skillset match (e.g., Hart and Moore, 1990; Hart, 1995; Rhodes-Kropf and Robinson, 2008) plays a dominant role in post-merger talent reallocation, limited evidence supports the screening channel, where low-quality or redundant inventors are let go (Lee et al., 2018; Lagaras, 2021). The emphasis on skillset match underscores the importance of aligning inventors' expertise with the technological areas of the combined entity.
Implications for labour market dynamics
Overall, this paper studies the restructuring of innovative labour following M&A and examines whether M&A transactions lead to a reallocation in innovative labour (i.e., inventors) analogous to real asset reallocation across firms. These findings imply that mergers have an economically important impact on the restructuring and productivity of the innovative labour force, both within and beyond the combined entity.
References
Hart, O., 1995. Firms, contracts, and financial structure. Clarendon press.
Hart, O., Moore, J., 1990. Property Rights and the Nature of the Firm. Journal of Political Economy 98, 1119–1158.
Kaplan, S.N., Weisbach, M.S., 1992. The Success of Acquisitions: Evidence from Divestitures. The Journal of Finance 47, 107–138.
Lagaras, S., 2021. Corporate Takeovers and Labor Restructuring. University of Pittsburgh Working Paper.
Lee, K.H., Mauer, D.C., Xu, E.Q., 2018. Human Capital Relatedness and Mergers and Acquisitions. Journal of Financial Economics 129, 111–135.
Maksimovic, V., Phillips, G., 2001. The Market for Corporate Assets: Who Engages in Mergers and Asset Sales and Are There Efficiency Gains? The Journal of Finance 56, 2019–2065.
Rhodes-Kropf, M., Robinson, D.T., 2008. The Market for Mergers and the Boundaries of the Firm. The Journal of Finance 63, 1169–1211.
Schoar, A., 2002. Effects of Corporate Diversification on Productivity. The Journal of Finance 57, 2379–2403.
March 2024
Enhancing Real Estate Investment Trust (REIT) Return Forecasts via Machine Learning
Attempts to predict stock market returns are as old as the stock markets themselves. However, for today’s efficient markets, one would expect predictability to be nearly non-existent. But the reality is more dynamic, driven by an arms race of data availability, empirical innovation and market efficiency.
Enter the brave new world of machine learning (ML), which has ignited another wave of academic research on asset return predictability. ML algorithms are especially adept at handling the complexities of financial data, notably non-linearities and interactions between predictors. The seminal paper by Gu et al. (2020) showcased this strength. They found that ML algorithms, such as random forests and neural networks, have an edge over traditional linear models in predicting next month’s return for U.S. stocks. They achieved a modest, yet positive, out-of-sample R2 of 0.3–0.5%.
For bonds, the predictability is an order of magnitude higher. Bianchi et al. (2021) report out-ofsample R2 values as large as 5% for bonds. Additionally, Leippold et al. (2022) indicated that in less-efficient Chinese stock market, the predictive power of ML models reaches out-of-sample R2 values of up to 3%. Notably, these predictions remain economically significant even after accounting for transaction costs.
Kahshin Leow and I contribute to this growing literature with an analysis of Real Estate Investment Trusts (REITs). REITs are interesting to study since their returns depend, ultimately, on the performance of the properties they own. If these assets produce predictable returns then one might also see predictability at the fund level. Using stock market information (CRSP) and a selection of macroeconomic variables, we conduct a horse race in which various empirical models compete to predict the returns of all REITs traded on U.S. exchanges from 1990 to 2022. We find that the predictability of REIT returns sits between that of general stocks and bonds, as our models achieve out-of-sample R2 ranging between 0.5–3%, depending on the selected time frame (Table 1).
Table 1: Monthly out-of-sample REIT-level prediction performance (percentage R2 oos)
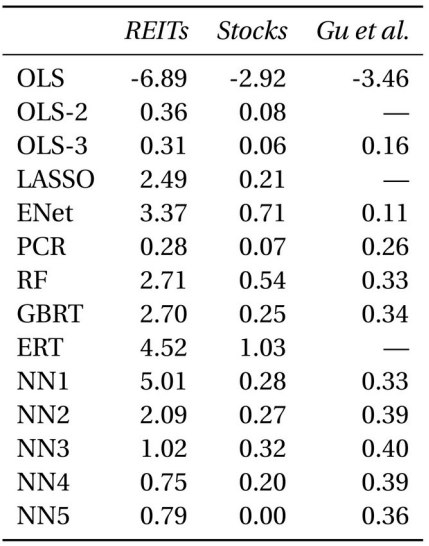
Notes: This table reports monthly Roos for the entire panel of REITs and stocks using OLS with all variables (OLS), OLS using only size and book-to-market (OLS-2), OLS using only size, book-to-market, and momentum (OLS-3), least absolute shrinkage and selection operator (LASSO), elastic net (ENet), principal component regression (PCR), random forest (RF), gradient boosted regression trees (GBRT), extremely randomized trees (ERT), and neural networks with one to five layers (NN1–NN5). In addition, we add the corresponding numbers for the US stock market as analyzed in Gu et al. (2020). All the numbers are expressed as a percentage.
Although the predictive power of these models may appear modest at first glance, their impact on portfolio optimization is sizeable. Allen et al. (2019) emphasized the importance of even slight predictive advantages. In our study, portfolio returns improved significantly when REITs were selected based on predicted performance, both in long-only and long-short portfolios (Figure 1).
Figure 1: Cumulative return of ML portfolios (value weighted)
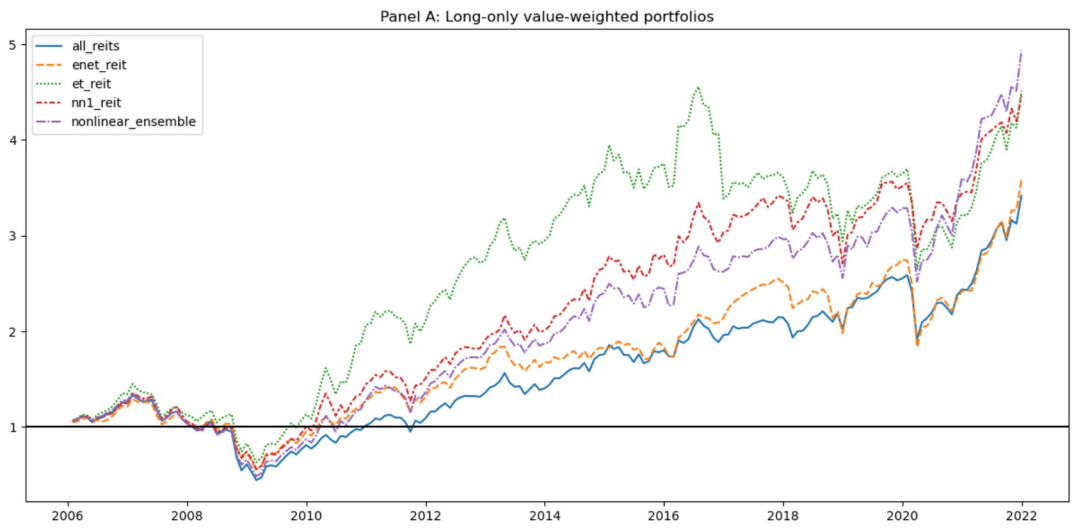
Notes: This figure shows the cumulative returns of the best performing machine learning portfolios. The portfolios are based on a long-only strategy of holding REITs in the top 30% quantile, and the benchmark portfolio is the weighted index of all REITs in the sample period.
This predictability also enhances the optimization of mean-variance portfolios, in line with Markowitz's (1953) demand that “we must have procedures for finding reasonable μi and σij. These procedures [...] should combine statistical techniques and the judgment of practical men”. Our results showed that portfolios where we update stock mean expectations based on ML predictions outperformed naive 1/n portfolios (Table 2).
Are these results large enough to trade on it? We are not sure yet. What we are confident of, however, is that REITs returns are more predictable than previously thought, especially in times of high heterogeneity of REIT returns as, for instance, seen in 2020/21.
Table 2: Performance of machine learning portfolios using mean-variance optimization
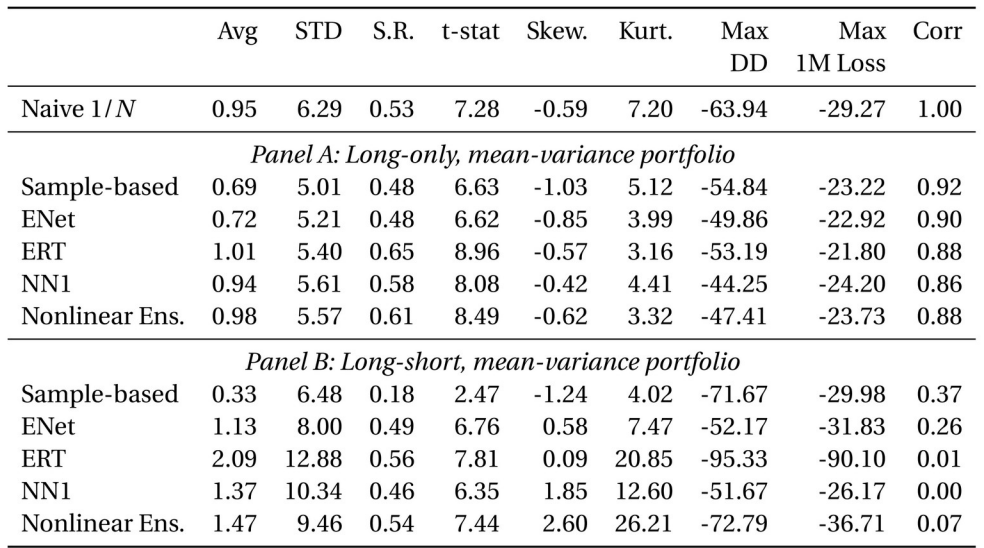
Notes: This table reports the out-of-sample performance measures for the best performing machine learning models using mean-variance optimization. The naive strategy involves holding a portfolio weight of 1/N in each of the N REITs. In Panel A, the mean-variance portfolios are constrained to long-only positions to allow for an apples-to-apples comparison to the naive 1/N portfolio. In Panel B, the mean-variance portfolios are permitted to take long-short positions. “Avg” : average realized monthly return(%). “Std”: the standard deviation of realized monthly returns(%). “S.R.”: annualized Sharpe ratio. “T-stat": t-statistic of realized monthly returns. “Skew”: skewness. “Kurt”: kurtosis. “MaxDD”: the portfolio maximum drawdown (%). “Max 1M Loss”: the most extreme negative realized monthly return(%). “Corr": correlation of realized monthly returns against the naive 1/N portfolio returns.
Bibliography:
- Allen, D., Lizieri, C., Satchell, S. 2019. In defense of portfolio optimization: What if we can forecast? Financial Analysts Journal 75:3,20-38.
- Bianchi, D., Buchner, M., Tamoni, A. 2021. Bond Risk Premiums with Machine Learning. The Review of Financial Studies 34(2):1046-1089.
- Gu, S., Kelly, B., Xiu, D. 2020. Empirical asset pricing via machine learning. The Review of Financial Studies 33(5),2223–2273.
- Leippold, M., Wang, Q., Zhou, W. 2022. Machine learning in the Chinese stock market. Journal of Financial Economics 145(2),64–82.
February 2024
The article at a glance
Sunwoo Hwang, an Assistant Professor of Finance at Korea University Business School, and Biwon Lee, a finance PhD candidate at W.P. Carey School of Business at Arizona State University, measure the quality of the relationship between employees and management and examine its causal effects on business outcomes such as profitability, labor productivity, and employee retention.
This paper asks whether it pays to invest in labor relations. Unlike the traditional view of labor as a production input like capital, this study recognizes that employees may not be passive contributors but actively react to the perceived quality of their relationship with management. When employees’ perceptions are more positive than those of management, employees may exert greater effort than explicitly contracted through wages and non-wage benefits or choose to remain with their current employers instead of transitioning to similar firms.
Challenges in study
Addressing the research question faces two primary challenges. Firstly, the intangible and bilateral nature of labor-management relationships makes it difficult to measure their quality. Secondly, even if we can measure it, it is also difficult to randomly allocate varying levels of this intangible and study its causal effects on business outcomes. We overcome these obstacles by using data from surveys that pose the same set of questions to both employees and management about their relationship and exploiting within-sampling-unit variation in the intangible, which is random conditional on assumptions discussed and tested in the paper.
Key findings and implications
Using a proxy for labor-management relational quality perceived by employees relative to management (hereafter, relational quality) and a strategy for causal inference, we find a positive association between relational quality and a firm’s future profitability, productivity, and retention. Notably, this association is not observed when considering relational quality perceived by employees or management alone. These findings carry two implications. Firstly, relational quality, closely intertwined with corporate culture and influencing employee satisfaction, has the potential to generate long-term value and be viewed as relational capital. Secondly, bilateral intangible factors, such as labor relations, should be evaluated based on input from both parties. In the absence of data enabling such a bilateral evaluation, prior research and ESG rating agencies have evaluated these factors unilaterally, relying on either the perspectives of employees or management gathered through surveys or information disclosed by management through regulatory filings or websites.
Measuring relational quality
To quantify relational quality, we compute the difference between numerical responses given by employees and management on a three-to-five-point scale for each survey question. We then aggregate these score differences by computing their principal components (PCs) and take the first PC that we show represents significant variation in these score differences as our proxy for relational quality. The proxy reflects the reality where employees form their perception taking managerial perception communicated within the organization as a benchmark. It thereby captures the relative perception of employees, which may go unnoticed by management and potentially lead to unforeseen improvements in labor productivity or employee retention.
Research design
Our causal inference capitalizes on variation in relational quality within each sampling unit. Since businesses are randomly sampled to constitute each unit for survey purposes, their selection is inherently random. However, there is a potential issue of omitted variable bias, where other characteristics within each business may correlate with relational quality and subsequently influence outcomes such as profitability, productivity, and retention. To this end, we show that observable characteristics do not significantly differ between businesses with high and low relational quality, mitigating concerns about omitted variable bias. Moreover, to address the possibility of reverse causality, where business outcomes might affect relational quality, we estimate the association between relational quality and future outcomes, after showing that the associations do not simply reflect their contemporaneous associations.
Validating the proxy for relational quality
We validate our proxy by demonstrating its strong correlations with labor relations events, which we believe have stronger effects on employees’ perceptions than those of management. The proxy is positively correlated with agreement between employees and management on wage issues, working conditions, and job security. Conversely, the proxy is negatively correlated with disagreement on a wage increase rate and actions against management. Furthermore, we show that these correlations are driven by employees’ perceptions.
The effects of relational quality on profitability, labor productivity, and employee retention
Using the proxy, we show that relational quality exhibits a positive and statistically significant association with future profitability. This finding aligns with prior research showing that firms with higher employee ratings enjoy greater stock valuation. While such increased valuation could be due to anticipated future cash flows or market mispricing, our results lend support to the former explanation. In contrast, when considering relational quality perceived by management alone, we find no significant association with future profitability. This observation is in line with other research showing that management’s proclaimed values are not significantly linked to operating performance. Next, we decompose relational quality into three distinct dimensions of culture, policy, and dispute and show that the cultural aspect accounts for the positive association between relational quality and future business outcomes. Regarding channels, we find evidence supporting labor productivity and employee retention. Specifically, relational quality is positively associated with future labor productivity and negatively with future employee turnover, with the latter being due to an improvement in retention rather than recruiting.
Underlying mechanisms
Our analysis of the varying employee responses and the varying impacts of relational quality offer further insights into underlying mechanisms. Firstly, the observed improvement in retention is driven by inexperienced employees as opposed to experienced ones, suggesting that employees with less firm-specific skills and lower switching costs are more responsive to relational quality. Secondly, reinforcing this notion, our results are (resp. are not) more pronounced in businesses that invest in the human capital development of rank-and-file employees (resp. middle managers or high-skill workers). Lastly, our findings are stronger in privately held businesses, which typically face challenges in attracting and retaining employees compared to their public counterparts.
Implications for the divergence of ESG ratings
Lastly, we elicit the implications for ESG rating divergence. We find that management-perceived relational quality is positively and significantly correlated with the S (social) score, whereas relational quality or employee-perceived relational quality does not show such a correlation. This observation leads us to reinterpret the lack of significant associations between management-perceived relational quality and future outcomes; bilateral attributes based on one-sided evaluations, which constitute the S score, may exhibit insignificant associations with future business outcomes, thus providing unsatisfactory references for firms and investors seeking to capitalize on the
January 2024
The article at a glance: Cambridge Endowment for Research in Finance (CERF) Research Associate, Tom Auld, explores whether markets were irrationally overconfident as results unfolded on the night of the UK’s “Brexit” referendum.
Was there a “bubble for Remain” on the night of the EU referendum?
The UK's vote for Brexit on 23rd June 2016 was the first great political shock of that year (the second being Donald Trump's win in the US presidential election). It had profound effects on financial markets (Aristeidis and Elias, 2018; Alkhatib and Harasheh, 2018; Sultonov and Jehan, 2018; Caporale et al., 2018). Global risk assets sold off sharply, with the pound immediately losing over 10% against the dollar. The result was also seemingly against all expectations. Betting odds for leaving the EU were around 4 to 1 during the final week of the campaign and bottomed out at 10 to 1 shortly after voting closed. This was despite tight polling that showed only a small lead for `Remain’, within the margin of error of most polls. Much of the literature on the topic suggests the possibility of the presence of mass bias in beliefs about the UK's voting intentions, with a "bubble" in opinion for remain (Gelman and Rothschild, 2016; Fry and Brint, 2017; Wu et al., 2017). But the question remains, did this bias for “Remain” persist on the night of the EU referendum as results were announced.
How the night unfolded.
The night of the referendum provided a unique opportunity to study market efficiency. It is not controversial to assume that the only information relevant to financial asset prices during the night was the referendum. Furthermore, the results from 382 distinct voting districts would be released at different times over the course of a few hours. Information was slowly drip fed to the markets during what is usually a quiet overnight session.
Voting closed at 10pm. Two minutes later YouGov released a poll on the day. This showed a small lead of 51.6% for Remain versus 48.4% for Leave. The sampling standard error was 3%. This implies the lead for remain was well within the margin of sampling error (let alone the systematic error in polling methodology). At the same time, the betting markets were implying around a 10% likelihood of Brexit.
Around midnight results began to arrive. By 1:17am ten areas had reported. Eight had vote-shares for Brexit above expectation. The average shock in these first results was +3.2% for Brexit. If repeated nationally this swing would reverse the lead for Remain. Risk assets began to sell off as the results arrived, but the descent took until well after 4am for the electorate’s decision to be fully reflected. The BBC finally projected a vote to leave the EU at 4:39:32am.
A novel Bayesian approach.
Previous work (Wu et al., 2017) attempted to demonstrate market inefficiency in the pound market using an asymptotic OLS based electoral modelling approach. However, such an approach relies on large numbers of results being known to accurately model the distribution of the unknown vote for Brexit. However, by the time sufficient datapoints are available it can be argued (and we do) that the result should already be known.
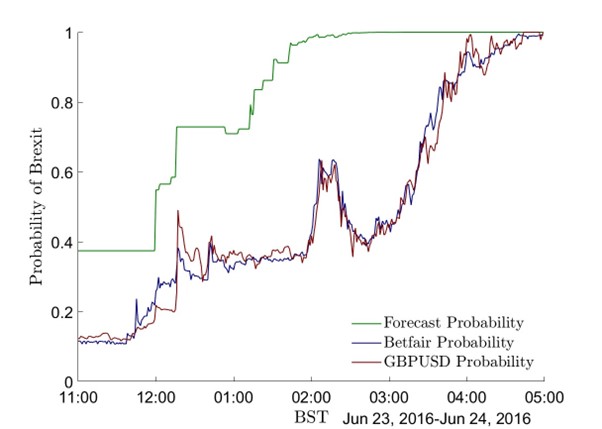
A method is required that enables an analyst to make a forecast knowing only few results (or one, or even zero!) We achieve this using a novel Bayesian methodology. The Bayesian approach uses a prior probability distribution that encapsulates beliefs about the likelihood of the unknown result. Those beliefs are updated as information becomes known via Bayes rules. Our prior is a joint semi-parametric distribution of the results of all 382 voting districts. We make use of expectations for these areas published by psephologist Chris Hanretty on 7th June 2016 in a blog titled “What to expect on the night”. These are used to calibrate our prior. Following updates “in real-time” as results arrive, an implied probability for Brexit is simulated. We also calculate implied probabilities of Brexit from financial asset prices, making use of the fact that financial prices are cointegrated with betting markets under certain conditions (Auld, 2022). We can then relate our electoral model probabilities to those implied by the real time evolution of the market determined prices. We find that both betting and financial markets appear to be slow in absorbing the information contained in the vote by around 3 hours.
A fully robust conclusion.
Our model relies on the choice of several hyperparameters to represent investor beliefs at the start of the night through the prior distribution. One could of course object to any of the values chosen. As part of robustness check we vary hyperparameters and check our results. We find that only two variables meaningfully affect the speed of converge.
The first hyperparameter of interest is the level of uncertainty in our prior. This is represented by the standard error in the vote share for Brexit. It is equivalent to the prior belief of the systematic error of recent polls. We find a standard error for general elections in polling error of around 2.5%. The higher the standard error, the higher the starting probability for Brexit but the slower the convergence to certainty. It is inconceivable that the once in a lifetime Brexit referendum could have polls as accurate as general elections (which occur every 4 years). We chose a conservative value of 5% in our core model. However, we find that increasing this hyperparameter does not change our conclusions meaningfully.
The second hyperparameter that is important is the correlation ρ between shocks from different constituencies. The higher the value of ρ the greater the effect a surprise in one area will have on the expectations of those in others yet to announce. Thus, higher ρ will cause faster convergence. For general elections this value is around 0.3. However, we again find that varying ρ below 0.3 significantly does not change our core conclusion that markets were slow to price Brexit by the order of hours.
Simply irrational behaviour.
The Bayesian approach allows us to go one step further in our analysis and ask what possible values of hyperparameters in our prior, and hence investor beliefs, are implied by market behaviour. We find that the markets were so slow to reflect the results that a value for ρ of between zero and 0.01 is required. This is close to assuming shocks from the one voting district are fully independent of others. It can be shown that ρ is the ratio of systematic national polling error variance to total variance of all constituency polling errors. For general elections this ratio is found to be stable and around 30%. It is unthinkable that investors could believe that only 1% of the variance of the collection of the 382 results is explained by the national polling error. It is as though investors failed to price in any effect of the surprises for Brexit from the initial results on the large numbers of areas yet to report. The conclusion is that both bettors and investors in financial markets were simply irrational and could not believe that the UK was voting to leave the UK.
The conclusion of this work is that without a shadow of a doubt the "bubble for remain'' persisted well into election night.
This blog is based upon published work co-authored with Professor Oliver Linton, current Chair of the Faculty of Economics.
Featured research
Auld, T., & Linton, O. (2023). Corrigendum to “The behaviour of betting and currency markets on the night of the EU referendum.” International Journal of Forecasting, 39(4), 1945-1948.
Auld, T., & Linton, O. (2019). "The behaviour of betting and currency markets on the night of the EU referendum." International Journal of Forecasting, 35(1), 371–389.
Article references
Auld, T. 2022. “Betting and Financial Markets Are Cointegrated on Election Night.” Available at SSRN: https://ssrn.com/abstract=4268381
Alkhatib, A., Harasheh, M. 2018. “Performance of Exchange Traded Funds during the Brexit Referendum: An Event Study.” International Journal of Financial Studies. 6(3), 1-12.
Aristeidis, S., Elias, K. 2018. “Empirical analysis of market reactions to the UK's referendum results - How strong will Brexit be?” Journal of International Financial Markets, Institutions and Money. 53, 263-286.
Caporale, G. M., Gil-Alana, L., Trani, T. 2018. “Brexit and Uncertainty in Financial Markets.” International Journal of Financial Studies. 6(1), 1-9.
Fry, J., Brint, A. 2017. “Bubbles, blind-spots and brexit.” Risks. 5(3), 37.
Gelman, A., Rothschild, D. 2016. “Something's Odd About the Political Betting Markets.” PredictWise blog, https://blog.predictwise.com/somethings-odd-about-the-political-betting-..., 12 Jul 2016.
Sultonov, M., Jehan, S. N. 2018. “Dynamic linkages between Japan's foreign exchange and stock markets: Response to the Brexit referendum and the 2016 U.S. presidential election.” Journal of Risk and Financial Management. 11(3), 34.
Wu, K., Wheatley, S., Sornette, D. 2017. “The British Pound on Brexit Night: A Natural Experiment of Market Efficiency and Real-Time Predictability.” Swiss Finance Institute Paper no. 17-12.